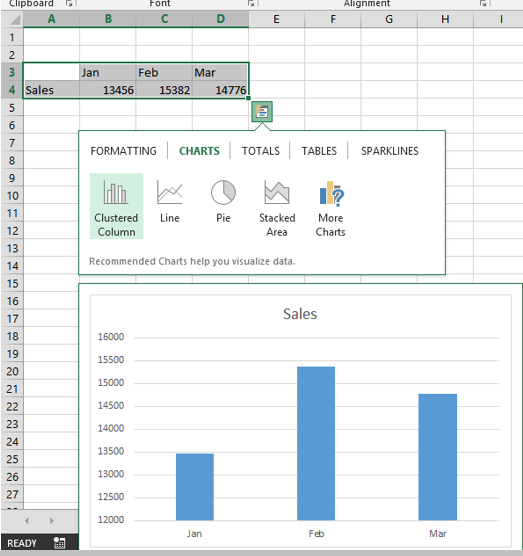
Excel 2013 offers a new, easy way to analyze data. If you have a set of information, like sales data for example, highlight the data, right click and pick Quick Analysis.
A bar pops up with all of the major analytical and formatting components including Conditional Formatting, Charts, Totals, Tables and Sparklines. Hovering over the various options let you see the result without yet committing to say, building a chart. Clicking an item applies the item to the data.